The challenge
Municipal utilities or energy suppliers are counted as “critical infrastructures” as soon as they supply a certain number of households. They are particularly in the focus of potential cyber-attacks. The IT Security Act of the Federal Office for Information Security (BSI) therefore requires that the IT systems used are specially secured and that attacks must be reported.
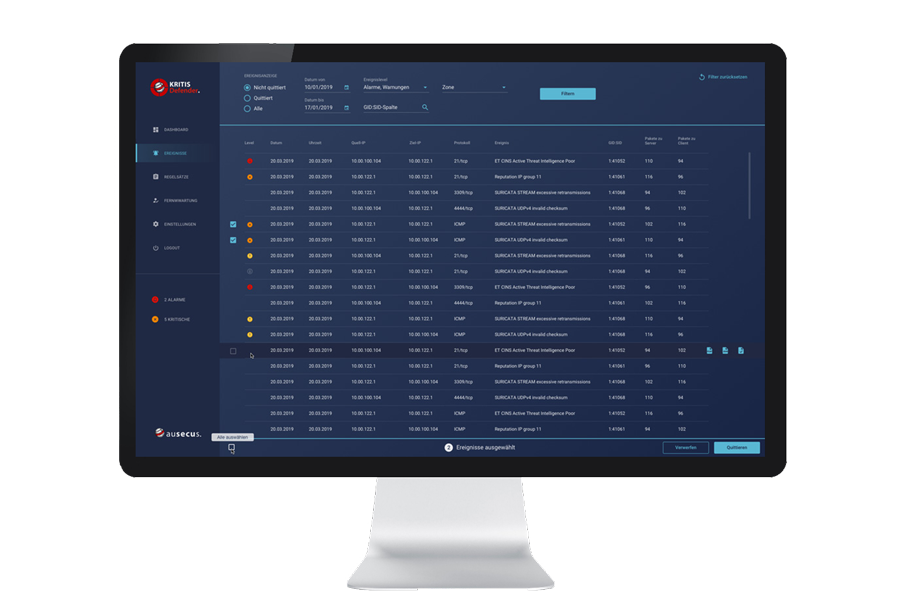
A so-called Intrusion Detection System (IDS) is intended to efficiently monitor and evaluate the network. Suspicious processes can thus be detected at an early stage, fended off and archived for audits.
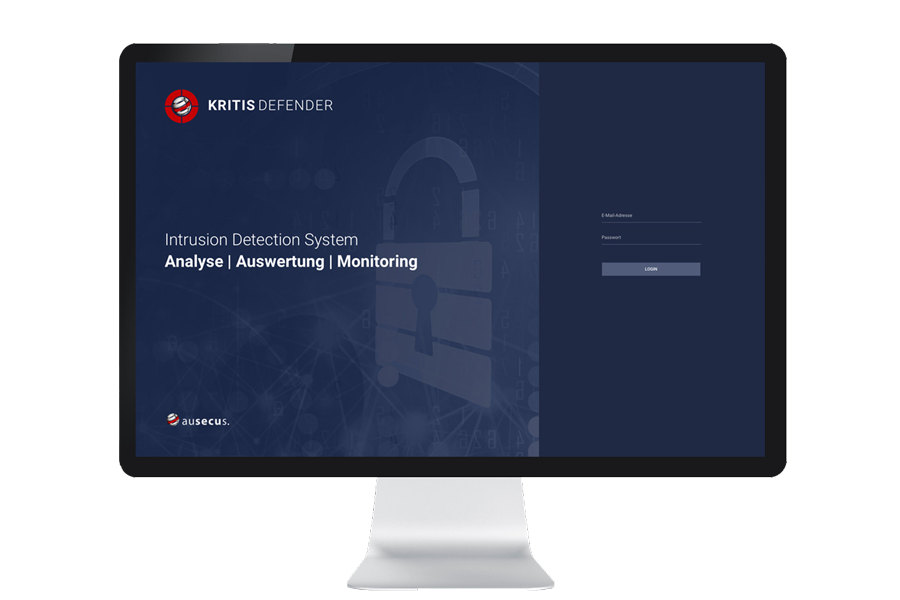
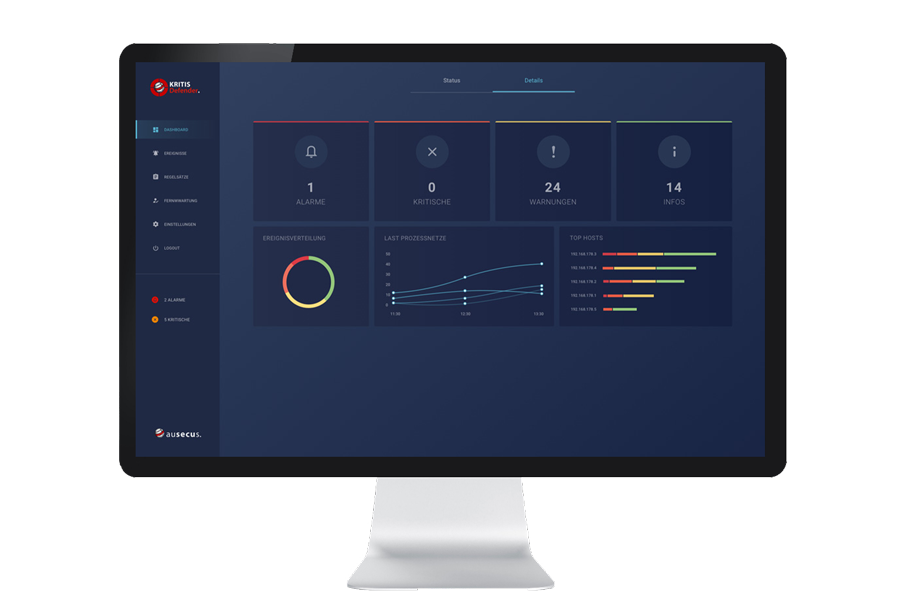
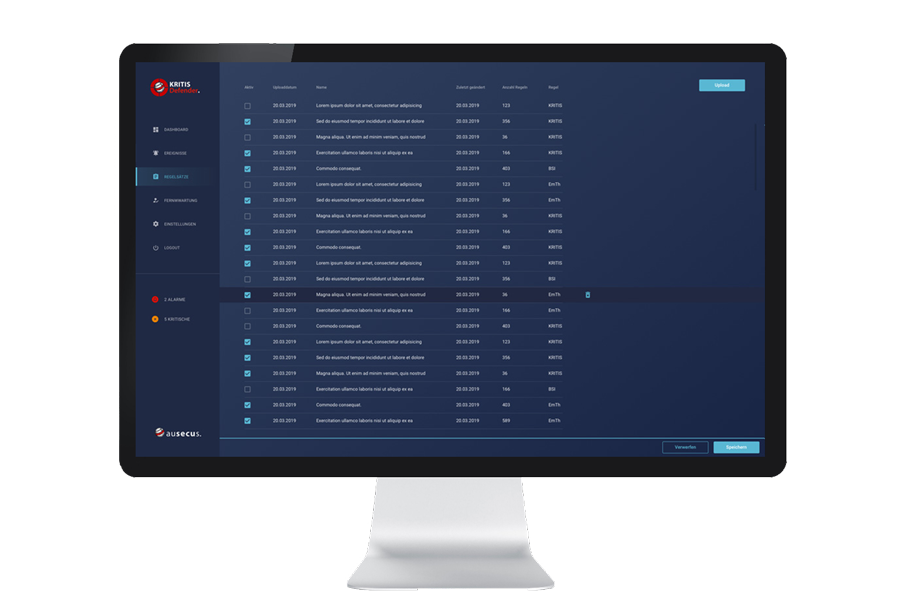
XITASO has developed a web application for ausecus, the KRITIS Defender, through which the network can be efficiently monitored and evaluated.
Context of use
Through observation and interviews with the users in their working environment, our UI/UX experts take a closer look at the context of use. It’s about understanding who the users are and what tasks they want to carry out.
It is particularly important to find out in which context the tasks are completed. For example, is there high time pressure or many parallel work activities? But the framework conditions, such as the hardware used, also influence the later concept.
Users
Who will end up operating the application?
Tasks
What are the most common tasks?
Environment
In what context is the application used?
Ressources
Which hardware is used?
Users
The users are at the center of the entire process. If they have difficulty completing their tasks, they will not use the new software and the overall target will not be reached.
The main users of the IDS program in this case were the administrators and employees of the IT security department of municipal utilities and energy suppliers.
How can you picture the users in concrete terms?
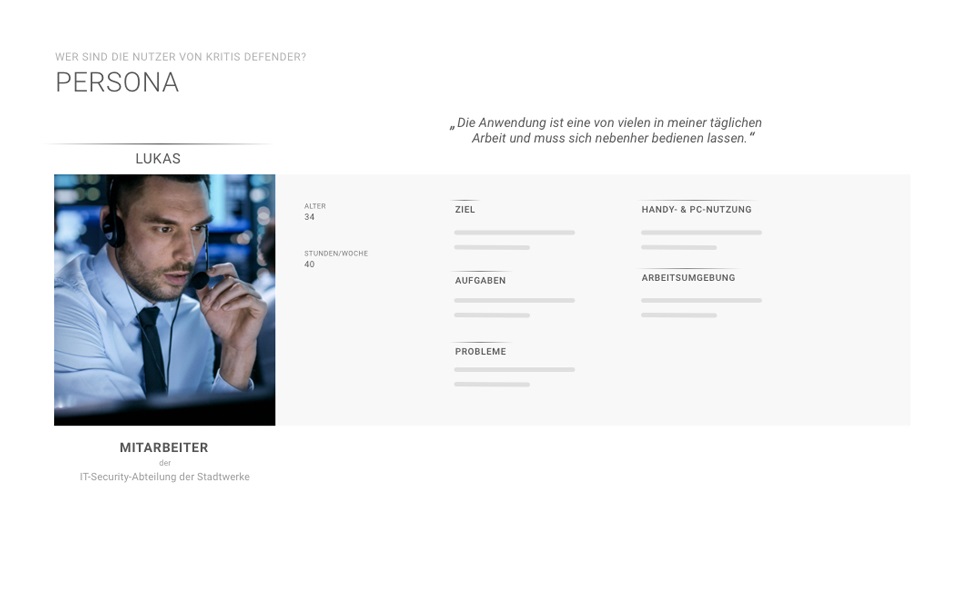
By creating personas, the users are described in detail and are each representative of an entire user group. All project participants thus have a concrete picture in mind of who the application is being developed for.
Due to the detailed presentation with image, name and characteristics, the person can be remembered easily. Product features, interaction concepts or appearance of the application can be better assessed and compared again and again during development.
Iterative screen design
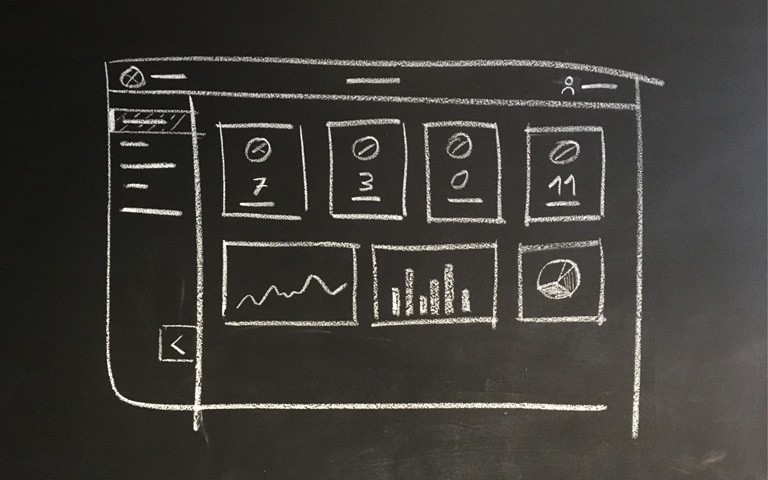
Both in the discussion of the requirements and in the discussion of technical questions with the development, visualizations serve fast communication, so that all project participants have a common understanding of the application. Already in the workshop, the first sketches are created on whiteboard, blackboard or paper, on the basis of which various solutions can be discussed clearly.
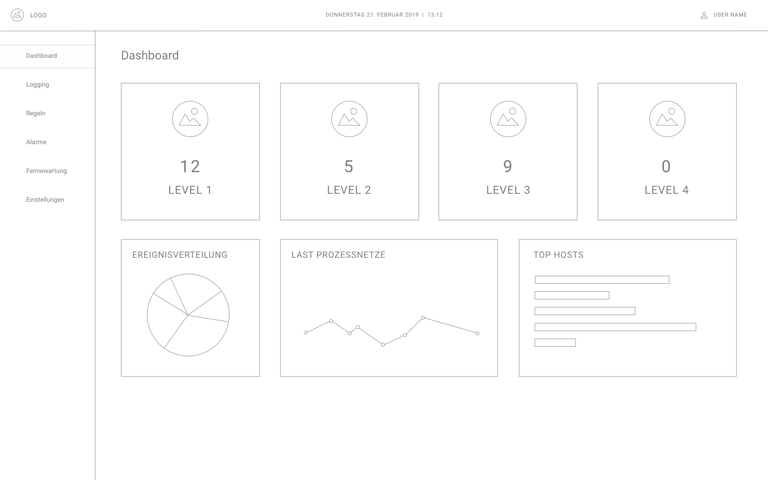
The sketches are subsequently further elaborated in digital form and the development is discussed again with the customer. The concept matures step by step in a collaborative process in which all project participants can identify with the product.
Sketch in the workshop
Digital wireframes with more details
Visual design with final colors and icons
Visual Design
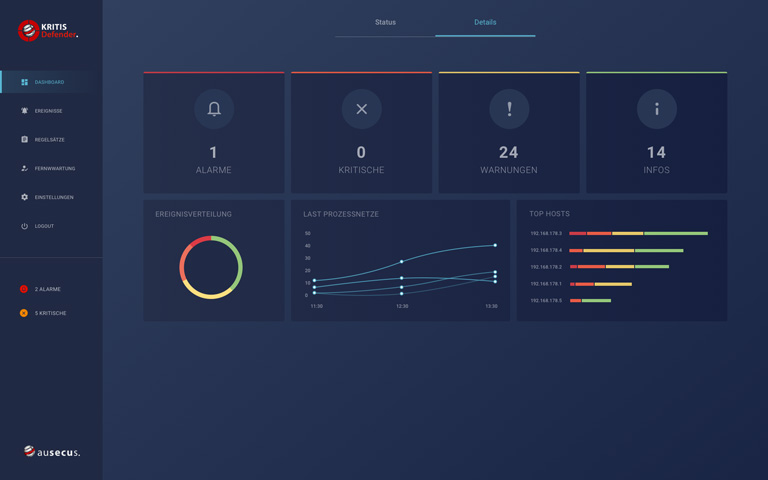
Another important part of the UI/UX process is the visual design of the application. The visual design determines how the application affects the users and whether they think of the application with a positive feeling and use it.
During the concept phase of the Intrusion Detection System, care was already taken to ensure that the correct content is clearly displayed, and that navigation is easy to understand. The visual design now goes one step further. In keeping with the customer’s corporate design, a harmonious color world is defined.
Colors for backgrounds, charts, fonts or highlighted elements that are to be the focus of the users, are coordinated with each other.
Icons make functions more visual and thus faster for users to grasp. Usually, a combination of icon and text is used to be as clear as possible. The application is also often used in dark environments, which is why a dark version was created in addition to a classic light variant. The eyes have to change less when switching between environment and monitor and do not tire as quickly.
Animated status indicator
In the user survey, it was found that KRITIS DEFENDER is only one of several applications that users have to operate at the same time. The most important thing here is the status display. If a critical event occurs, users must quickly become aware of it.
In a reduced view, therefore, only the system status (red, yellow, green) is displayed over the entire surface. An animation illustrates the urgency of the status at different speeds.
Other projects
Are you interested in a project, a service or do you have another question?

Simon Engelmann
Tel. +49 821 885882-34
simon.engelmann@xitaso.com


